So… is that Good? Understanding Key Benchmarks in Social Media.
Education
You just completed your social media campaign and the results are in. What did you learn? What kind of results did you get? What kind of results were you expecting?
By now higher education marketers should be well aware that social channels are critical for connecting and engaging with prospects and students. Yet few really have a solid grasp of what is working or whether their efforts are delivering desired results. And unfortunately, teams that can’t clearly articulate what’s working or how their efforts are contributing to the overall picture are going to be dealing with reduced budgets at a time when investing in these channels should be increasing!
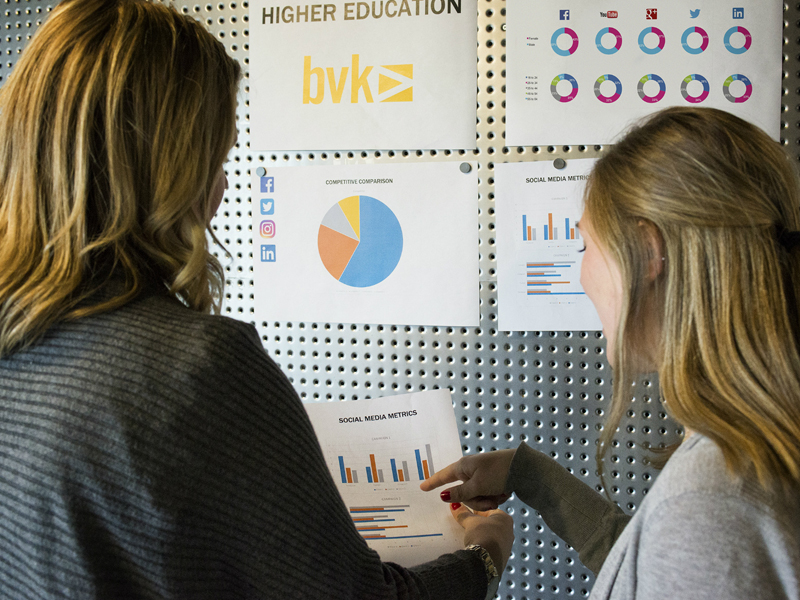
We’ll provide some social benchmark information that will begin to fill in the data gaps. (Special shout out to Bruce Dierbeck, our Director of Social Media at BVK, who worked with his contacts at Facebook, Twitter and LinkedIn to secure engagement metrics within the education space.)
Let’s get started…
While Facebook may not be the go-to social platform for all Millennials, it’s still a very important channel. According to eMarketer, the 25-34 age range is the most common demographic, making up 29.7% of the platform’s users.
Within the education vertical, average Facebook Click Thru Rates (CTR) are at 1.05% and Cost Per Thousand (CPM) is averaging $5.85. Note that these numbers are based on the past 90 days. So if you are running a campaign on Facebook or plan to in the near future…this is your comparison.
According to Twitter, here are the benchmarks in the higher education vertical:
- Engagement Rate: 1.15% — Engagement Rate is a measure of how many people who see your Tweet interact with it.
- Cost per Engagement Rate: $1.05
- Cost per View: $0.15
- Cost per Link Click: $2.00
- Cost per Follow (Follower Campaign): $1.30
Of all the social channels, LinkedIn is arguably the least popular among younger Millennials. However, for schools that are interested in engaging with returning or graduate students, LinkedIn becomes much more relevant. Plus, Microsoft just announced it will acquire LinkedIn for $26 billion. The connection with Microsoft could have a big impact on this platform down the road.
For this channel, we were able to get benchmarks for both the Education category and the platform’s general numbers.
Average CTR for Sponsored Content
- .35% LinkedIn General
- .40% LinkedIn Education vertical
Average Engagement Rate for Sponsored Content
- .40% LinkedIn General
- .45% LinkedIn Education vertical
Average Engagement Rate for Organic Content
- .7% LinkedIn General
- .7% LinkedIn Education vertical
Note: Organic content will (most of the time) have a higher engagement rate since this group has proactively opted to get your message.
Average Cost Per Click (CPC) for Sponsored Content
Varies, based on audience targeting. LinkedIn recommends building the audience in the Sponsored Updates tool and using the suggested bid range as the basis for our goal.
Broader audiences tend to have lower CPCs. More specific targeting results in higher CPC. For Example, advertisers targeting a US MBA audience see an average CPC bid of $9 in the auction. Advertisers with strong, engaging content will likely clear below the average CPC ($3-$8).
Looking at average CPM is similar. Broader audiences with strong content can expect $20-$30 CPM while a US MBA-like audience would be $40ish.
Note: different from the other platforms, LinkedIn calculates CTR as clicks/impressions while Engagement Rate is (Clicks + All Social Actions) divided by Impressions.
So, now that you are armed and dangerous with key benchmarks from three of the main social platforms…
Ask yourself: how am I doing? And more importantly, how will I use this info to improve my brand’s performance within these channels?
BVK is a leader in the strategic social media space. Learn more about how we can get your brand to exceed the benchmarks above.